NYC AirBnB
You can find details about how I obtained the NYC Airbnb dataset here
Let’s set some global options
knitr::opts_chunk$set(
  fig.width = 6,
  fig.asp = .6,
  out.width = "90%"
)

library(tidyverse)
library(viridis)
Let’s clean the data a bit
nyc_airbnb = read_csv("data/nyc_airbnb.csv") %>%
  select(-X1) %>%
  mutate(stars = review_scores_location/2) %>%
  rename(borough = neighbourhood_group)
Now that we have our data and libraries ready. Let the exploration begin!
Some interesting questions about AirBnb!
- Does rating vary by neighborhood, room type, or both?
- How is price related to other variables?
- Where are rentals located?
- What’s the most and least expensive area?
- Which area has the highest density of listings?
- What are some host characteristics? How many listings? What’s associated with ratings?
nyc_airbnb %>%
count(room_type) %>% knitr::kable()| room_type | n |
|---|---|
| Entire home/apt | 26050 |
| Private room | 22822 |
| Shared room | 1169 |
nyc_airbnb %>% count(borough) %>%
  arrange(desc(n)) %>%
knitr::kable() | borough | n |
|---|---|
| Manhattan | 23052 |
| Brooklyn | 20234 |
| Queens | 5454 |
| Bronx | 960 |
| Staten Island | 341 |
Does rating vary by neighborhood, room type, or both?
nyc_airbnb %>%
 group_by(neighbourhood) %>%
 summarize(median = median(stars, na.rm = TRUE),
           mean = mean(stars, na.rm = TRUE),
           number_of_listings = n()) %>%
knitr::kable()| neighbourhood | median | mean | number_of_listings |
|---|---|---|---|
| Allerton | 4.50 | 4.553571 | 28 |
| Arden Heights | 4.25 | 4.250000 | 2 |
| Arrochar | 5.00 | 4.718750 | 19 |
| Arverne | 5.00 | 4.700000 | 81 |
| Astoria | 5.00 | 4.789148 | 940 |
| Bath Beach | 5.00 | 4.818182 | 13 |
| Battery Park City | 5.00 | 4.918919 | 66 |
| Bay Ridge | 5.00 | 4.791262 | 133 |
| Bay Terrace | 4.50 | 4.500000 | 5 |
| Bay Terrace, Staten Island | 4.75 | 4.750000 | 3 |
| Baychester | 4.25 | 4.250000 | 6 |
| Bayside | 4.75 | 4.708333 | 45 |
| Bayswater | 4.50 | 4.416667 | 17 |
| Bedford-Stuyvesant | 4.50 | 4.534142 | 3552 |
| Belle Harbor | 5.00 | 5.000000 | 6 |
| Bellerose | 5.00 | 4.444444 | 14 |
| Belmont | 4.50 | 4.642857 | 17 |
| Bensonhurst | 4.50 | 4.448980 | 62 |
| Bergen Beach | 4.50 | 4.571429 | 12 |
| Boerum Hill | 5.00 | 4.932099 | 196 |
| Borough Park | 4.50 | 4.494444 | 124 |
| Breezy Point | 4.75 | 4.750000 | 2 |
| Briarwood | 4.50 | 4.613636 | 53 |
| Brighton Beach | 5.00 | 4.769231 | 65 |
| Bronxdale | 5.00 | 4.687500 | 18 |
| Brooklyn Heights | 5.00 | 4.961538 | 148 |
| Brownsville | 4.50 | 4.241667 | 74 |
| Bull’s Head | 5.00 | 5.000000 | 5 |
| Bushwick | 4.50 | 4.625798 | 2461 |
| Cambria Heights | 4.50 | 4.692308 | 19 |
| Canarsie | 4.50 | 4.471963 | 127 |
| Carroll Gardens | 5.00 | 4.925258 | 230 |
| Castle Hill | 4.75 | 4.750000 | 5 |
| Castleton Corners | 5.00 | 4.875000 | 6 |
| Chelsea | 5.00 | 4.934833 | 1161 |
| Chelsea, Staten Island | NA | NaN | 1 |
| Chinatown | 5.00 | 4.722570 | 394 |
| City Island | 5.00 | 5.000000 | 15 |
| Civic Center | 5.00 | 4.794872 | 67 |
| Claremont Village | 4.50 | 4.300000 | 22 |
| Clason Point | 4.50 | 4.708333 | 19 |
| Clifton | 4.50 | 4.227273 | 13 |
| Clinton Hill | 5.00 | 4.805319 | 594 |
| Co-op City | 4.50 | 4.666667 | 6 |
| Cobble Hill | 5.00 | 4.929348 | 103 |
| College Point | 4.50 | 4.676471 | 20 |
| Columbia St | 5.00 | 4.763889 | 43 |
| Concord | 5.00 | 4.735294 | 19 |
| Concourse | 4.50 | 4.475000 | 52 |
| Concourse Village | 4.50 | 4.312500 | 37 |
| Coney Island | 4.50 | 4.447368 | 22 |
| Corona | 4.50 | 4.670454 | 53 |
| Crown Heights | 4.50 | 4.585004 | 1608 |
| Cypress Hills | 4.50 | 4.395238 | 118 |
| Ditmars Steinway | 5.00 | 4.770270 | 346 |
| Dongan Hills | 4.75 | 4.750000 | 2 |
| Douglaston | 5.00 | 4.875000 | 8 |
| Downtown Brooklyn | 5.00 | 4.896552 | 84 |
| DUMBO | 5.00 | 4.804348 | 38 |
| Dyker Heights | 4.50 | 4.638889 | 23 |
| East Elmhurst | 4.50 | 4.692000 | 152 |
| East Flatbush | 4.50 | 4.416667 | 397 |
| East Harlem | 4.50 | 4.509424 | 1191 |
| East Morrisania | 4.50 | 4.428571 | 8 |
| East New York | 4.50 | 4.267956 | 210 |
| East Village | 5.00 | 4.875550 | 2012 |
| Eastchester | 4.50 | 4.687500 | 12 |
| Edenwald | 5.00 | 4.750000 | 9 |
| Edgemere | 4.50 | 4.166667 | 9 |
| Elmhurst | 4.50 | 4.663889 | 226 |
| Eltingville | 5.00 | 5.000000 | 3 |
| Emerson Hill | 5.00 | 5.000000 | 4 |
| Far Rockaway | 4.50 | 4.500000 | 29 |
| Fieldston | 5.00 | 4.916667 | 13 |
| Financial District | 5.00 | 4.910405 | 604 |
| Flatbush | 4.50 | 4.633745 | 646 |
| Flatiron District | 5.00 | 4.981013 | 107 |
| Flatlands | 4.50 | 4.418182 | 70 |
| Flushing | 4.50 | 4.634561 | 422 |
| Fordham | 4.50 | 4.214286 | 35 |
| Forest Hills | 5.00 | 4.754310 | 148 |
| Fort Greene | 5.00 | 4.860955 | 451 |
| Fort Hamilton | 5.00 | 4.822222 | 57 |
| Fort Wadsworth | NA | NaN | 1 |
| Fresh Meadows | 4.50 | 4.673913 | 27 |
| Gerritsen Beach | 4.75 | 4.750000 | 3 |
| Glen Oaks | 4.50 | 4.500000 | 1 |
| Glendale | 4.50 | 4.428571 | 47 |
| Gowanus | 5.00 | 4.774510 | 245 |
| Gramercy | 5.00 | 4.923701 | 408 |
| Graniteville | 4.50 | 4.333333 | 5 |
| Grant City | 5.00 | 4.833333 | 3 |
| Gravesend | 4.50 | 4.662500 | 56 |
| Great Kills | 5.00 | 4.666667 | 9 |
| Greenpoint | 5.00 | 4.795073 | 1157 |
| Greenwich Village | 5.00 | 4.974359 | 412 |
| Grymes Hill | 5.00 | 4.833333 | 4 |
| Harlem | 4.50 | 4.631371 | 2807 |
| Hell’s Kitchen | 5.00 | 4.907673 | 2087 |
| Highbridge | 4.50 | 4.483333 | 32 |
| Hollis | 5.00 | 4.444444 | 13 |
| Holliswood | 4.50 | 4.500000 | 2 |
| Howard Beach | 5.00 | 4.818182 | 16 |
| Howland Hook | 4.50 | 4.500000 | 1 |
| Huguenot | 5.00 | 5.000000 | 3 |
| Hunts Point | 4.00 | 4.227273 | 14 |
| Inwood | 4.50 | 4.548781 | 266 |
| Jackson Heights | 5.00 | 4.744828 | 186 |
| Jamaica | 4.50 | 4.547771 | 191 |
| Jamaica Estates | 5.00 | 4.791667 | 21 |
| Jamaica Hills | 5.00 | 5.000000 | 3 |
| Kensington | 4.50 | 4.628906 | 171 |
| Kew Gardens | 5.00 | 4.807692 | 43 |
| Kew Gardens Hills | 4.50 | 4.625000 | 17 |
| Kingsbridge | 4.50 | 4.575472 | 66 |
| Kips Bay | 5.00 | 4.834232 | 511 |
| Laurelton | 4.50 | 4.583333 | 15 |
| Lighthouse Hill | 4.75 | 4.750000 | 3 |
| Little Italy | 5.00 | 4.842857 | 141 |
| Little Neck | 5.00 | 5.000000 | 2 |
| Long Island City | 5.00 | 4.748307 | 546 |
| Longwood | 4.50 | 4.473684 | 50 |
| Lower East Side | 5.00 | 4.819608 | 981 |
| Manhattan Beach | 4.50 | 4.571429 | 9 |
| Marble Hill | 5.00 | 4.750000 | 12 |
| Mariners Harbor | 4.25 | 4.250000 | 8 |
| Maspeth | 4.50 | 4.493506 | 97 |
| Melrose | 4.00 | 4.125000 | 6 |
| Middle Village | 4.50 | 4.692308 | 28 |
| Midland Beach | 5.00 | 4.700000 | 6 |
| Midtown | 5.00 | 4.919551 | 1696 |
| Midwood | 4.50 | 4.628049 | 121 |
| Mill Basin | 4.50 | 4.500000 | 6 |
| Morningside Heights | 5.00 | 4.829670 | 398 |
| Morris Heights | 4.50 | 4.500000 | 23 |
| Morris Park | 5.00 | 4.909091 | 16 |
| Morrisania | 4.50 | 4.583333 | 13 |
| Mott Haven | 4.50 | 4.409091 | 51 |
| Mount Eden | 4.50 | 4.555556 | 10 |
| Mount Hope | 4.50 | 4.571429 | 14 |
| Murray Hill | 5.00 | 4.834936 | 488 |
| Navy Yard | 4.50 | 4.681818 | 13 |
| Neponsit | 5.00 | 5.000000 | 2 |
| New Brighton | 4.50 | 4.333333 | 4 |
| New Dorp | 5.00 | 5.000000 | 2 |
| New Dorp Beach | 4.50 | 4.500000 | 4 |
| New Springville | 5.00 | 4.900000 | 8 |
| NoHo | 5.00 | 4.976923 | 81 |
| Nolita | 5.00 | 4.952586 | 339 |
| North Riverdale | 4.75 | 4.625000 | 10 |
| Norwood | 4.50 | 4.520000 | 37 |
| Oakwood | 5.00 | 5.000000 | 2 |
| Olinville | 5.00 | 5.000000 | 3 |
| Ozone Park | 4.50 | 4.557143 | 49 |
| Park Slope | 5.00 | 4.956221 | 544 |
| Parkchester | 4.50 | 4.637931 | 33 |
| Pelham Bay | 4.50 | 4.346154 | 15 |
| Pelham Gardens | 4.75 | 4.750000 | 25 |
| Pleasant Plains | NA | NaN | 1 |
| Port Morris | 4.50 | 4.357143 | 38 |
| Port Richmond | 4.50 | 4.357143 | 10 |
| Prince’s Bay | 5.00 | 5.000000 | 3 |
| Prospect Heights | 5.00 | 4.920128 | 371 |
| Prospect-Lefferts Gardens | 4.50 | 4.612766 | 574 |
| Queens Village | 4.50 | 4.583333 | 45 |
| Randall Manor | 4.50 | 4.500000 | 18 |
| Red Hook | 4.50 | 4.663934 | 72 |
| Rego Park | 5.00 | 4.641975 | 96 |
| Richmond Hill | 4.50 | 4.557971 | 79 |
| Richmondtown | 5.00 | 5.000000 | 1 |
| Ridgewood | 4.50 | 4.583612 | 413 |
| Riverdale | 5.00 | 4.833333 | 15 |
| Rockaway Beach | 5.00 | 4.738095 | 70 |
| Roosevelt Island | 5.00 | 4.692983 | 83 |
| Rosebank | 4.50 | 4.500000 | 4 |
| Rosedale | 4.50 | 4.413793 | 37 |
| Rossville | 5.00 | 5.000000 | 1 |
| Schuylerville | 4.50 | 4.600000 | 7 |
| Sea Gate | 5.00 | 4.666667 | 5 |
| Sheepshead Bay | 5.00 | 4.763441 | 154 |
| Shore Acres | 4.75 | 4.750000 | 9 |
| Silver Lake | 5.00 | 5.000000 | 2 |
| SoHo | 5.00 | 4.977032 | 380 |
| Soundview | 4.75 | 4.750000 | 9 |
| South Beach | 5.00 | 4.875000 | 5 |
| South Ozone Park | 4.50 | 4.558823 | 48 |
| South Slope | 5.00 | 4.939076 | 290 |
| Springfield Gardens | 4.50 | 4.500000 | 57 |
| Spuyten Duyvil | 4.75 | 4.625000 | 5 |
| St. Albans | 4.50 | 4.561224 | 62 |
| St. George | 5.00 | 4.743590 | 47 |
| Stapleton | 4.50 | 4.586207 | 34 |
| Stuyvesant Town | 5.00 | 4.769231 | 28 |
| Sunnyside | 5.00 | 4.785185 | 350 |
| Sunset Park | 4.50 | 4.656151 | 410 |
| Theater District | 5.00 | 4.903704 | 250 |
| Throgs Neck | 5.00 | 4.846154 | 14 |
| Todt Hill | 5.00 | 5.000000 | 1 |
| Tompkinsville | 4.50 | 4.590909 | 38 |
| Tottenville | 5.00 | 4.833333 | 4 |
| Tremont | 4.00 | 4.187500 | 10 |
| Tribeca | 5.00 | 4.954918 | 171 |
| Two Bridges | 4.50 | 4.638889 | 69 |
| Unionport | 4.50 | 4.500000 | 4 |
| University Heights | 4.50 | 4.473684 | 23 |
| Upper East Side | 5.00 | 4.875772 | 1952 |
| Upper West Side | 5.00 | 4.901019 | 2156 |
| Van Nest | 4.50 | 4.363636 | 15 |
| Vinegar Hill | 5.00 | 4.708333 | 31 |
| Wakefield | 4.50 | 4.500000 | 41 |
| Washington Heights | 4.50 | 4.585714 | 919 |
| West Brighton | 4.50 | 4.535714 | 17 |
| West Farms | 4.50 | 4.166667 | 5 |
| West Village | 5.00 | 4.974097 | 815 |
| Westchester Square | 4.50 | 4.583333 | 7 |
| Westerleigh | 5.00 | 5.000000 | 3 |
| Whitestone | 5.00 | 4.857143 | 12 |
| Williamsbridge | 4.50 | 4.465517 | 39 |
| Williamsburg | 5.00 | 4.856574 | 4168 |
| Willowbrook | 4.50 | 4.500000 | 1 |
| Windsor Terrace | 5.00 | 4.855634 | 173 |
| Woodhaven | 4.50 | 4.416667 | 73 |
| Woodlawn | 4.75 | 4.750000 | 8 |
| Woodrow | 4.50 | 4.500000 | 2 |
| Woodside | 5.00 | 4.708333 | 211 |
nyc_airbnb %>%
  group_by(room_type) %>%
  summarize(median_stars = median(stars, na.rm = TRUE),
            average_stars = mean(stars, na.rm = TRUE),
           number_of_listings = n())
## # A tibble: 3 x 4
## room_type median_stars average_stars number_of_listings
## <chr> <dbl> <dbl> <int>
## 1 Entire home/apt 5 4.78 26050
## 2 Private room 5 4.71 22822
## 3 Shared room 5 4.68 1169ggplot(nyc_airbnb, aes(x = stars), color = boro) +
geom_histogram() +
facet_grid(~room_type)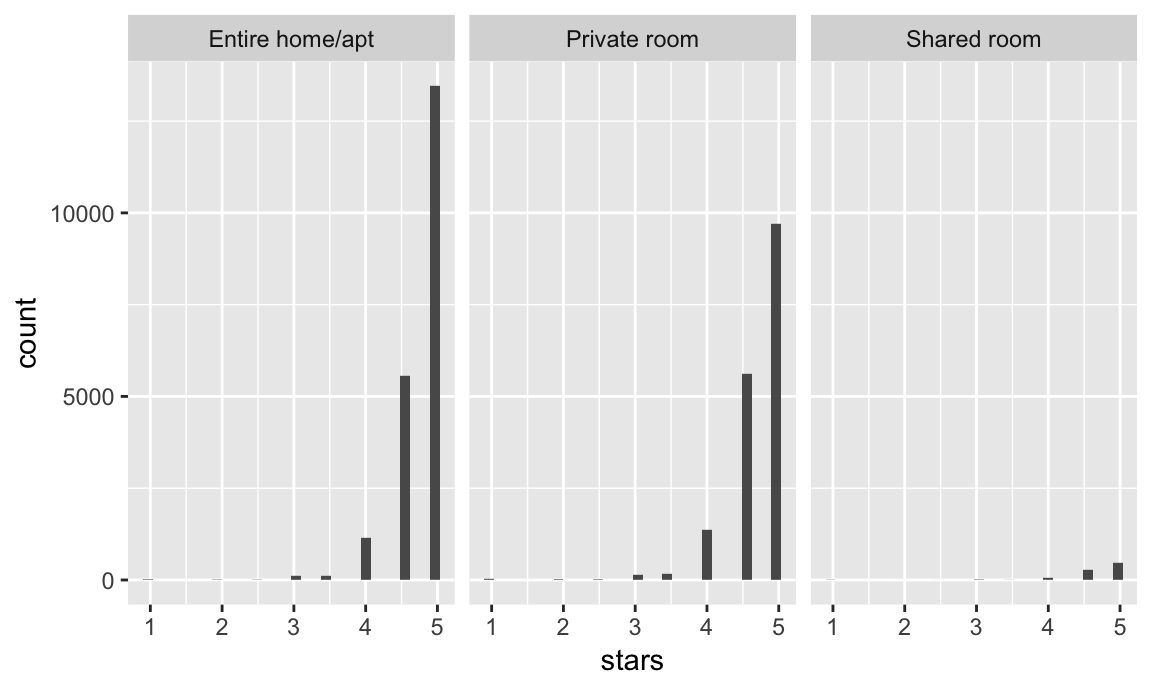
nyc_airbnb %>%
  group_by(borough, room_type) %>%
  summarise(
  mean_stars = mean(stars, na.rm = TRUE)) %>%
  spread(key = room_type, value = mean_stars)
## # A tibble: 5 x 4
## # Groups: borough [5]
## borough `Entire home/apt` `Private room` `Shared room`
## <chr> <dbl> <dbl> <dbl>
## 1 Bronx 4.59 4.50 4.35
## 2 Brooklyn 4.73 4.67 4.61
## 3 Manhattan 4.84 4.79 4.80
## 4 Queens 4.71 4.68 4.60
## 5 Staten Island 4.69 4.62 5Where are rentals located?
nyc_airbnb %>%
  filter(borough == "Manhattan", price < 1000) %>%
  ggplot(aes(x = longitude, y = latitude, color = price)) +
  geom_point(alpha = .2) +
  facet_grid(~room_type) +
  coord_cartesian() +
  scale_color_viridis()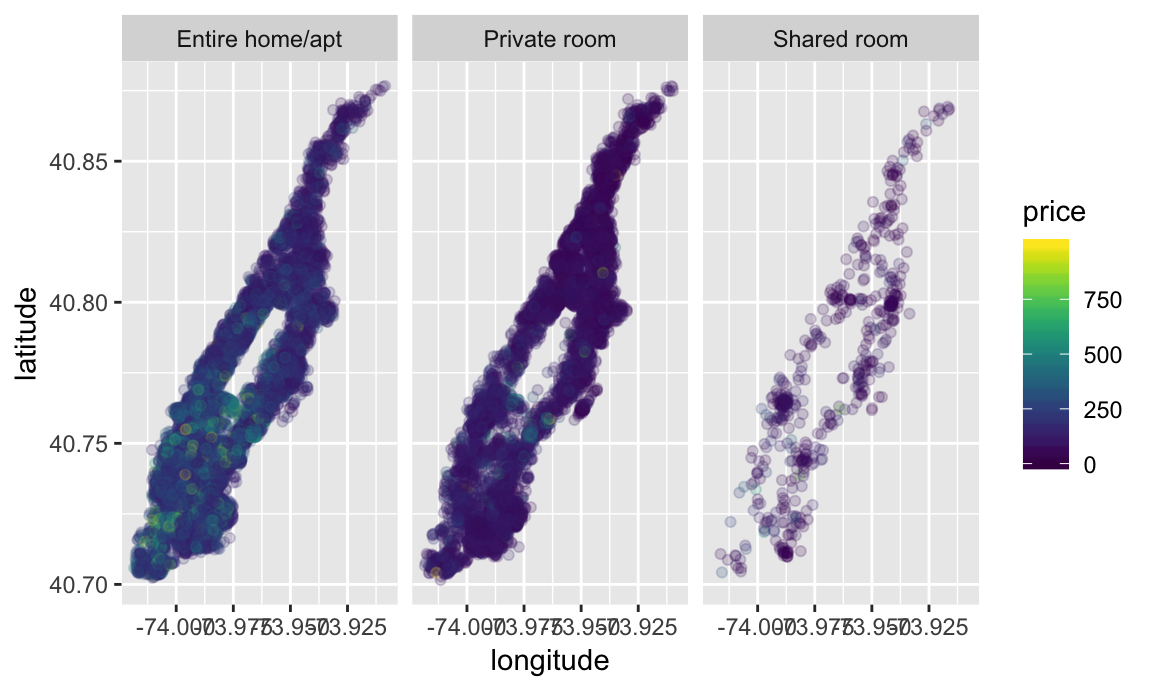
Entire homes are more expensive than other room types, and are more clustered in southern Manhattan.
Expensive areas
nyc_airbnb %>%
 select(borough, neighbourhood, price) %>%
 filter(borough == "Manhattan") %>%
 group_by(neighbourhood) %>%
 summarize(mean_price = mean(price, na.rm = TRUE),
           median_price = median(price, na.rm = TRUE)) %>%
  top_n(5, median_price) %>%
 arrange(desc(median_price))
## # A tibble: 5 x 3
## neighbourhood mean_price median_price
## <chr> <dbl> <dbl>
## 1 Tribeca 413. 251
## 2 NoHo 265. 245
## 3 Battery Park City 295. 225
## 4 Flatiron District 318. 218
## 5 Midtown 278. 210nyc_airbnb %>%
select(borough, neighbourhood, price) %>%
filter(borough == "Brooklyn") %>%
group_by(neighbourhood) %>%
summarize(mean_price = mean(price, na.rm = TRUE),
median_price = median(price, na.rm = TRUE)) %>%
top_n(5, median_price) %>%
arrange(desc(median_price))## # A tibble: 6 x 3
## neighbourhood mean_price median_price
## <chr> <dbl> <dbl>
## 1 DUMBO 190. 162.
## 2 Vinegar Hill 164. 159
## 3 Boerum Hill 180. 150
## 4 Brooklyn Heights 195. 150
## 5 Carroll Gardens 181. 150
## 6 Downtown Brooklyn 162. 150nyc_airbnb %>%
select(borough, neighbourhood, price) %>%
filter(borough == "Manhattan") %>%
group_by(neighbourhood) %>%
summarize(mean_price = mean(price, na.rm = TRUE),
median_price = median(price, na.rm = TRUE)) %>%
top_n(-5, median_price) %>%
arrange(median_price)## # A tibble: 6 x 3
## neighbourhood mean_price median_price
## <chr> <dbl> <dbl>
## 1 Washington Heights 89.4 70
## 2 Inwood 88.3 75
## 3 Roosevelt Island 103. 79
## 4 Marble Hill 82.2 89
## 5 Harlem 120. 90
## 6 Morningside Heights 109. 90nyc_airbnb %>%
select(borough, neighbourhood, price) %>%
filter(borough == "Brooklyn") %>%
group_by(neighbourhood) %>%
summarize(mean_price = mean(price, na.rm = TRUE),
median_price = median(price, na.rm = TRUE)) %>%
top_n(-5, median_price) %>%
arrange(median_price)## # A tibble: 6 x 3
## neighbourhood mean_price median_price
## <chr> <dbl> <dbl>
## 1 Gerritsen Beach 74 50
## 2 Borough Park 69.7 55
## 3 Gravesend 81.3 61
## 4 Cypress Hills 80.2 61.5
## 5 Brownsville 86.3 65
## 6 Bushwick 81.8 65