Exploratory Analyses
Victim Demographics
For our first exploratory analysis, we analyzed demographic information for victims of sex-related, weapon-related and drug-related felonies.
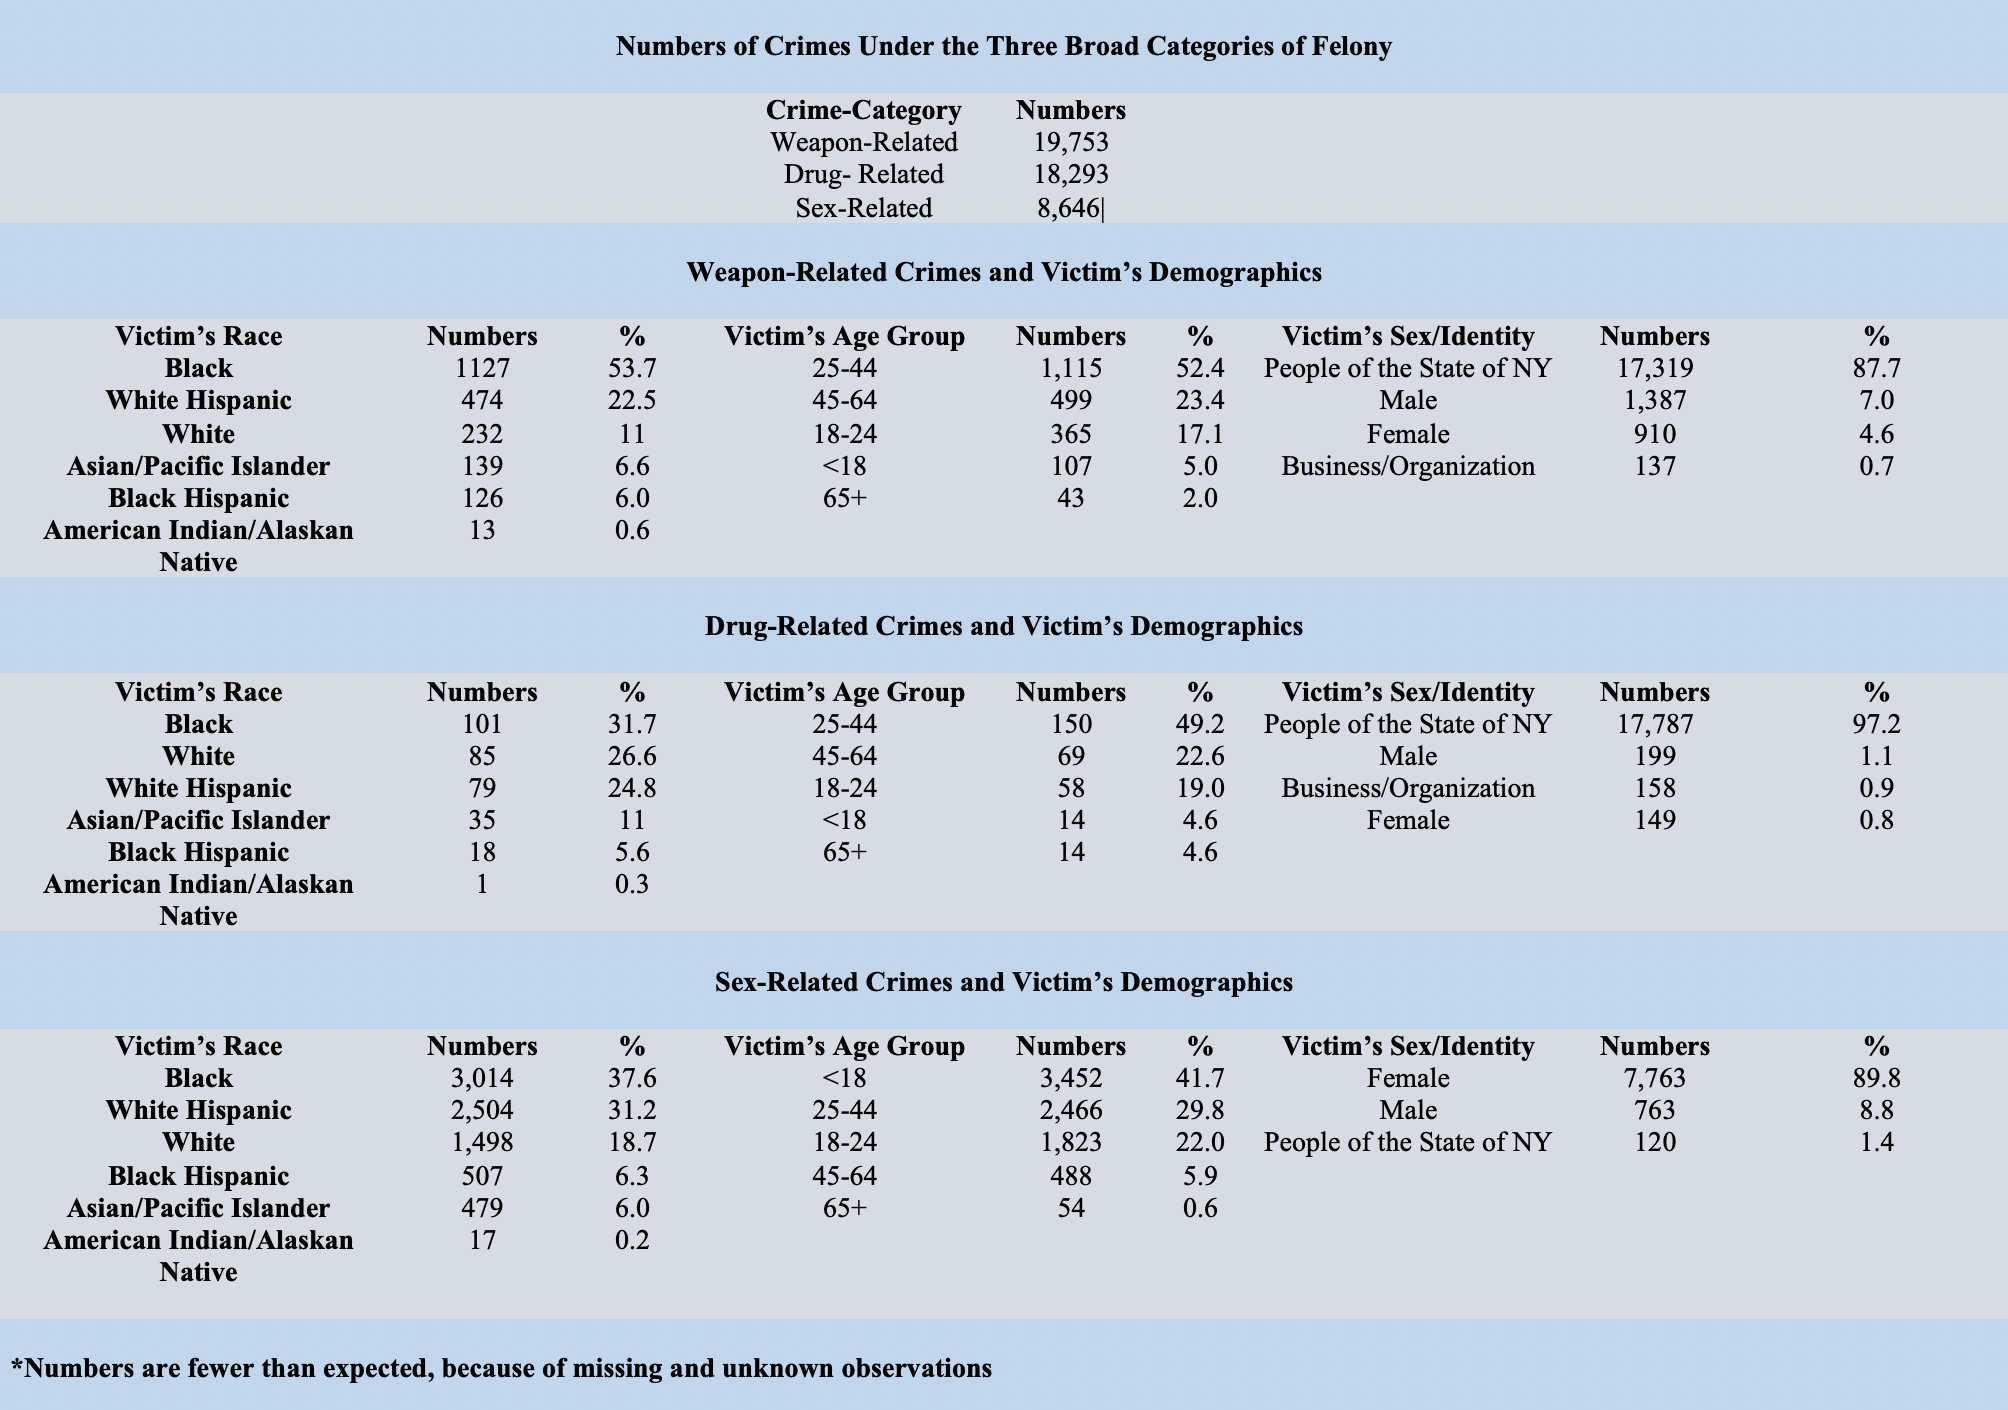
Note that in the table above, “People of the State of NY” indicates that the information was not provided by the city, presumably to protect the victims’ identity and privacy. Also of note is that young women are disproportionately affected by sex-relate felonies.
Click here to view the code for the demographics table.
Length of Reported Incident by Borough and Felony
For our second exploratory analysis, We examined whether the length of time between when the crime started and ended differed by borough and felony type. Examining the length of time between when the crime started and ended can serve as a proxy indicator of the severity of the crime. Longer times may mean the crime is more severe, harder to resolve, more violent, and may require more resources to deal with. Furthermore, differences in the length of reported felonies may have implications for law enforcement officials, policymakers, and urban residents.
Average Length of Incident by Borough and Crime Group
| Crime group | Count | Average time in days | Standard deviation |
|---|---|---|---|
| Drug-Related | 18293 | 0.5862466 | 12.315819 |
| Sex-Related | 8646 | 19.2362846 | 83.297645 |
| Weapon-Related | 19753 | 0.2820289 | 9.101974 |
| Borough | Count | Average time in days | Standard deviation |
|---|---|---|---|
| manhattan | 9200 | 3.43 | 34.55 |
| bronx | 12848 | 3.26 | 35.34 |
| brooklyn | 15014 | 3.58 | 35.11 |
| queens | 7995 | 5.71 | 44.88 |
| staten_island | 1634 | 6.00 | 56.49 |
There seems to be a marked difference in the average length of incidents across boroughs and felony type. Notably, we see that, on average, sex-related felonies seem to have a longer average incident length than drug- and weapon-related felonies. In terms of boroughs, Staten Island slightly ranks higher than the rest of the boroughs.
We wanted to investigate further. First, we visually investigated the distribution of the length of each incident across all boroughs and all three felony types.
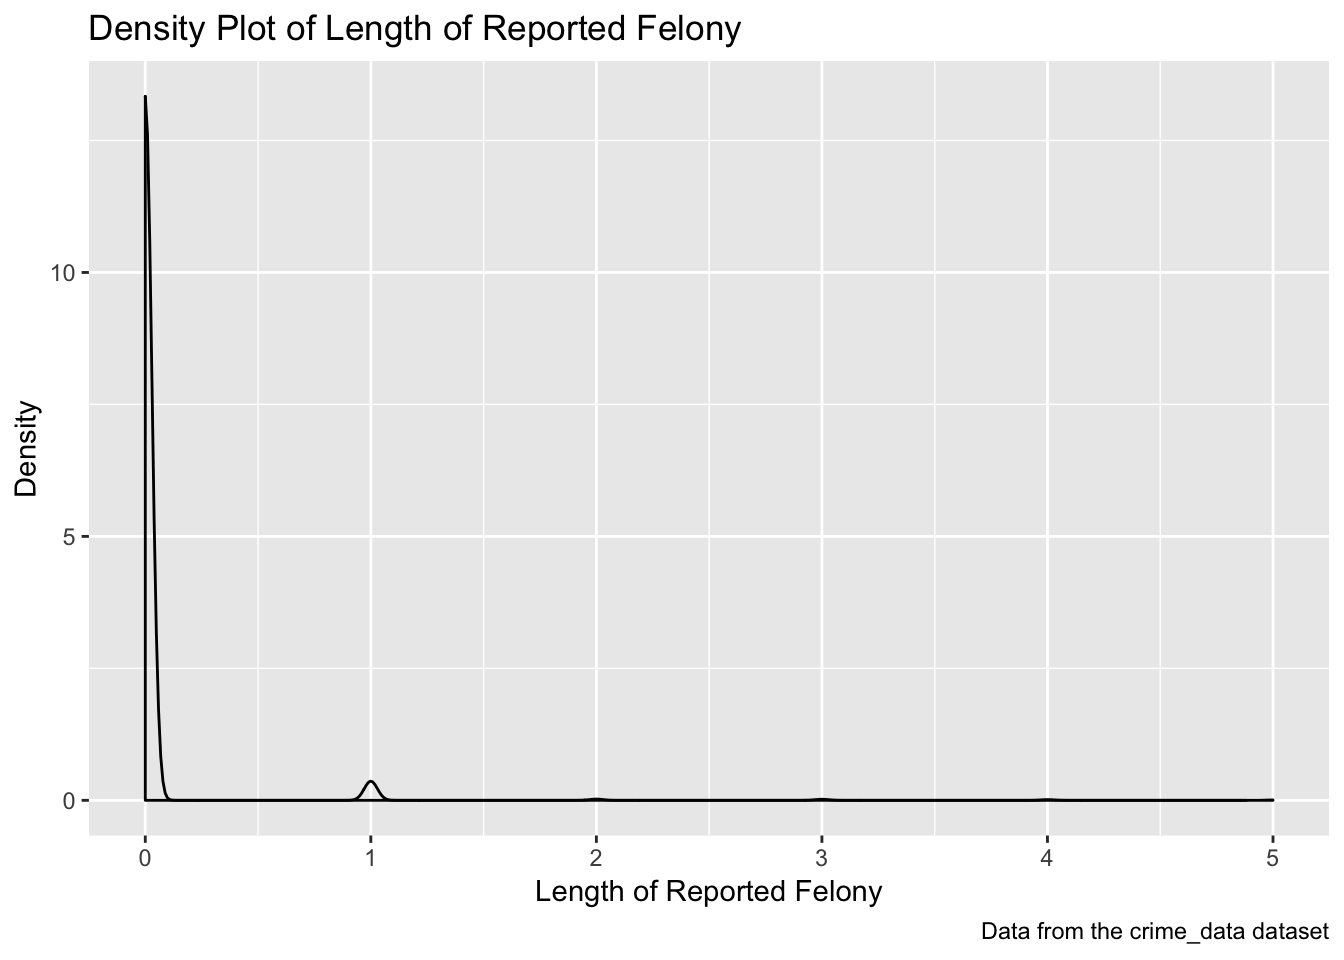
The density plot of the length of incidents above shows that most of the values seemed to fall under “0,” heavily skewing the data. In other words, most incidents occurred within a day. We also noticed a high number of missing values in our data.
We therefore excluded missing values and only looked at observations for which length of time of the incident was greater than 0 (i.e., greater than 1 day) to allow us to more clearly visualize and understand our data. The number of observations was still large and sufficient enough to observe patterns.
The table below shows the averages after the exclusions.
| Borough | mean_time |
|---|---|
| manhattan | 58.52056 |
| bronx | 71.31112 |
| brooklyn | 60.91128 |
| queens | 78.62651 |
| staten_island | 105.42025 |
We also visually examined the length of each reported felony across boroughs, shown below. 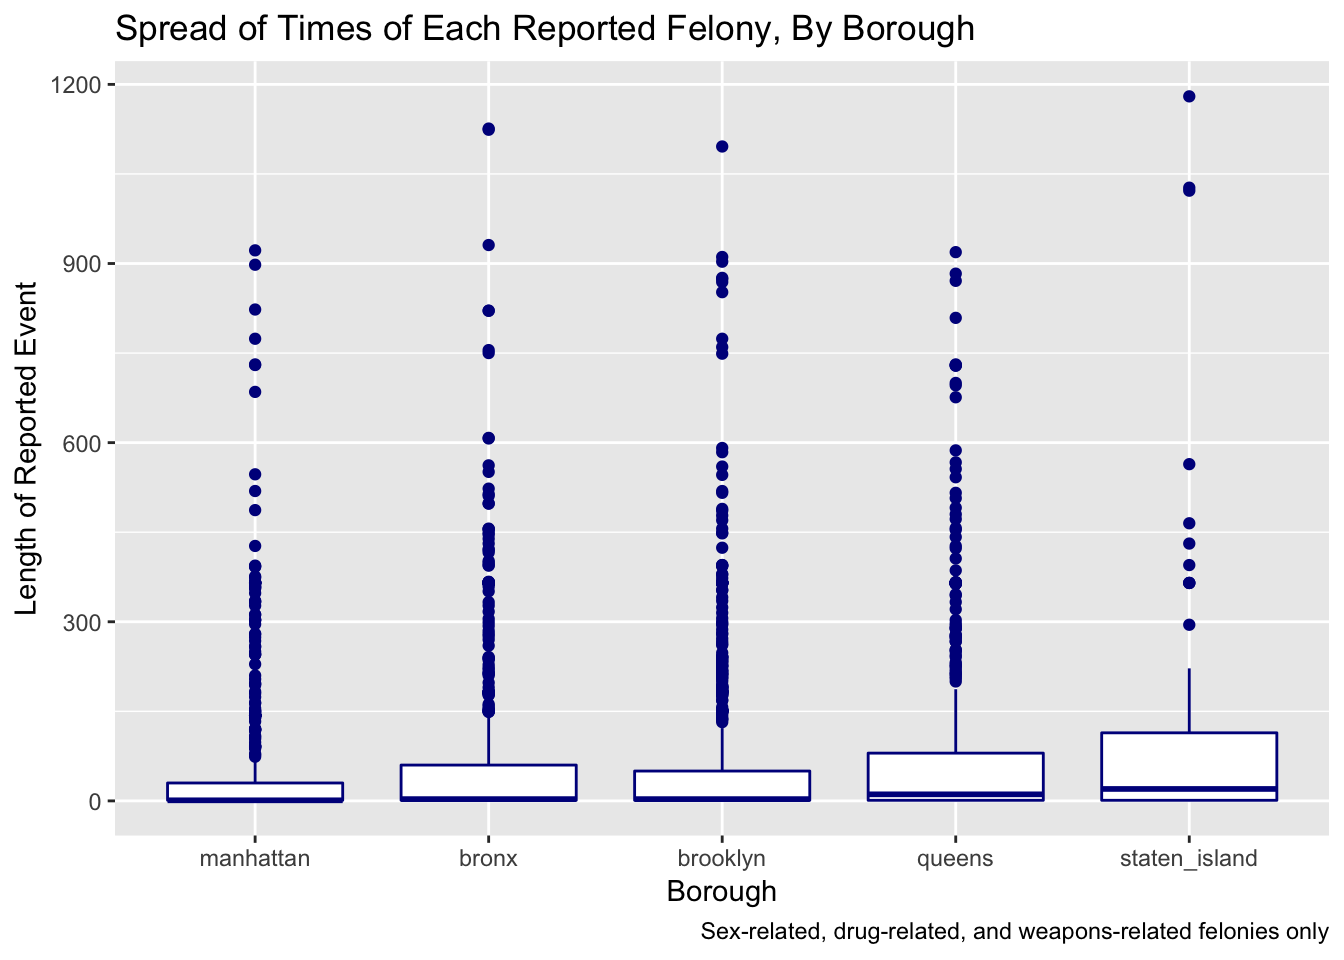
We see that for the average length of reported felonies, Staten Island clearly outranks the other borough, leading at 105.42 days. Queens is next (78.63 days), followed by the Bronx (71.31 days), Brooklyn (60.91 days), and Manhattan (58.52 days).
One reason that may account for Staten Island’s rank is that the borough has fewer observations compared to the other boroughs, so any outliers in Staten Island may easily and drastically skew the average. Another potential reason is that criminals may be more comfortable committing felonies in a borough that is less populated with other residents and law enforcement officials. Manhattan, on the other hand, is a more crowded borough - perhaps criminals feel less comfortable committing a felony in such an area. This may be particularly relevant and true if felonies are more severe or violent, and criminals need time, space, and less attention when committing these crimes. Indeed, we may be right - felonies comprise a more violent category, in relation to misdemeanors; felonies tend to include homicide, rape, robbery, arson, human trafficking, and so on.
Regarding the length of each reported felony across boroughs, we see that Bronx, Brooklyn, Manhattan, and Queens have significantly more outliers (and more observations) compared to Staten Island, giving a bit more credence to the first hypothesis stated above. We also notice that the median values, which tend to be a more stable measure against outliers than the mean, are close to 0 for all the boroughs, suggesting that many felonies still last around a single day despite our filtering out same-day felonies. Despite this, Staten Island still shows a median value that seems slightly above the values of the other boroughs.
Overall Felony Rates by Borough
For our third exploratory analysis, we chose to examine overall felony rates by borough. Doing so gives us a strong understanding as to how NYPD can prioritize their efforts when stemming crime; it also allows us to understand potential longitudinal trends for each borough. If, for example, felony rates have remained consistently high for a particular borough, laaw enforcement officials have suggestive evidence that the high rates are not a fluke and would be able to mobilize effects in that borough more effectively, readily, and directly.
To study this, we loaded information from the U.S. Census containing information on the total population in each of the boroughs to calculate felony rates. Next, we plotted the overall felony rates over 2014-2017 for each borough by merging the sex_drug_weapons dataset with the data from the U.S. Census.
<<<<<<< HEAD ======= >>>>>>> ad378d97a5a0c24088e7bad4b45b6cebaecf063eFrom the graph above, we notice some interesting findings. First, Bronx, by far, has had the highest overall felony rate from 2014-2017. Secondly, the felony rates for Brooklyn and Manhattan are very similar; this applies to Queens and Staten Island as well, which comprise the two boroughs with the lowest overall crime rates from 2014-2017. Third, we can see that felony rates decreased from 2016-2017 for all boroughs except for Brooklyn. The Bronx, in particular, has had a significant decrease in felony rates from 2016 to 2017. Lastly, overall felony rates across the years for all boroughs have tended to remain stable, generally speaking. As with the other exploratory analyses, note that these felonies are strictly sex-related, weapons-related, and drug-related felonies.
To examine this borough-specific trend more closely, we subsetted the graph by type of felony.
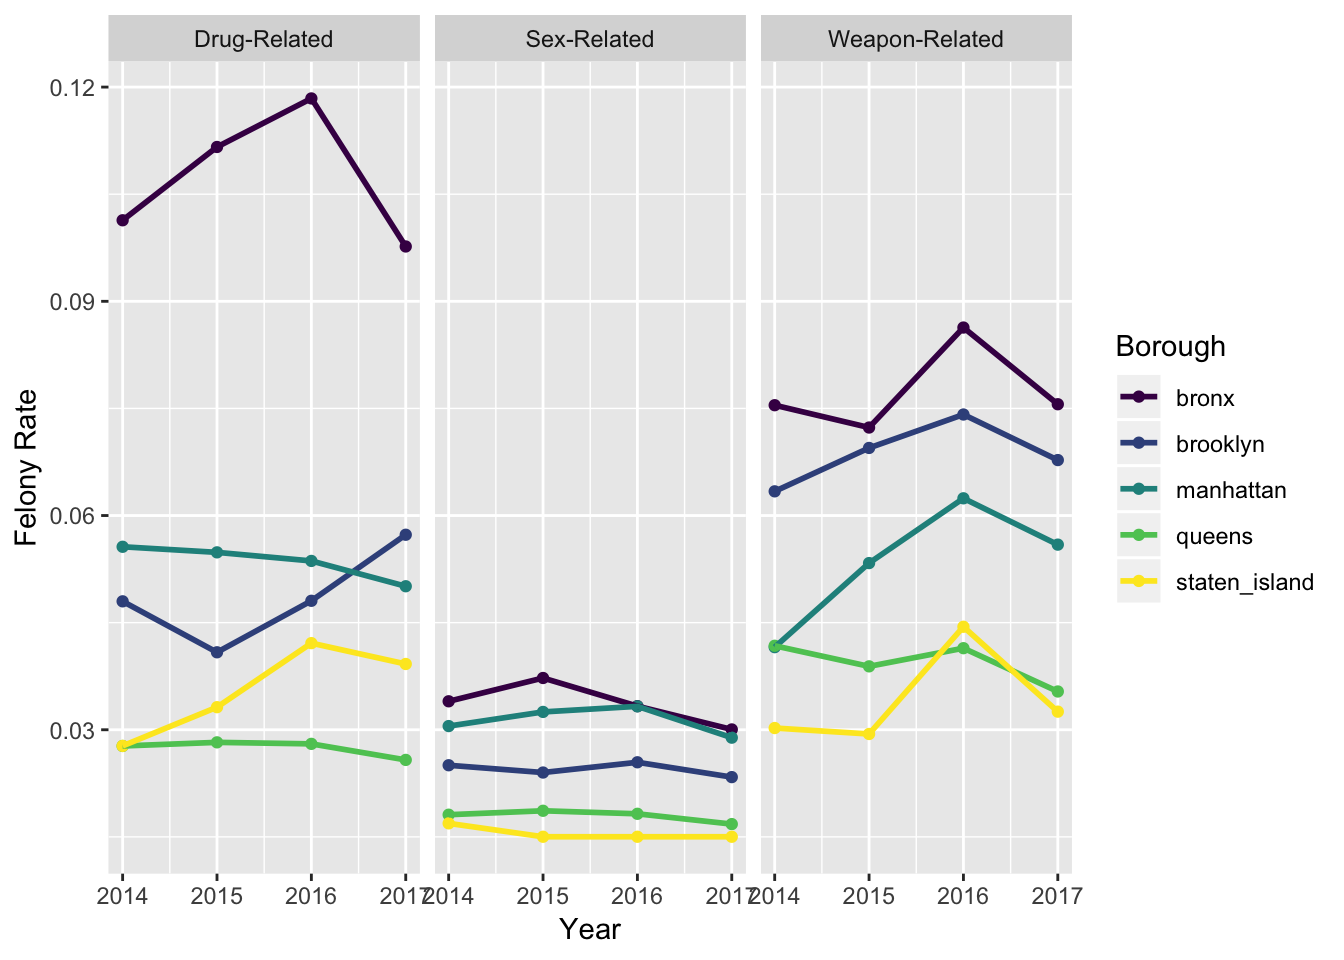
The stratification of overall felony rates over the years by type of felony (i.e., sex-related, drug-related, or weapons-related) provides a lot of information amongst the three graphs:
Broadly speaking, felony rates have decreased across the board from 2016 to 2017 for nearly all boroughs - only Brooklyn has seen a rise in the rate of drug-related felonies from 2015 to 2017.
Bronx has consistently had the highest crime rate over the last 4 years for all 3 types of felonies. We see a steep reduction, however, in the crime rate for the Bronx between the years of 2016 and 2017 - this change is most notable among the graph showing drug-relaed felonies.
Drug-related and weapons-related felonies occur significantly more often compared to sex-related felonies. This may not be all that surprising, given the heavy interplay between drugs and weapons.
Queens and Staten Island have had the lowest felony rates across all years and across all three types of felonies.
Geographical Distribution of Felonies
Our final exploratory analysis examined the geographical distribution of felonies, beyond the borough level. We thought this was critical to investigate because each borough contains such unique and vastly different neighborhoods comprising that borough - solely looking at associated factors at the neighborhood level ignores and masks these different identities within each neighborhood. Examining at this level also gives us more clear-cut information on the absolute numbers of felonies in each neighborhood and provides specific information regarding where law enforcement officials can prioritize efforts.
<<<<<<< HEADWe first created a visual showing clusters and pockets of the 3 types of felonies in absolute numbers.
From this visual, we can easily spot areas within each borough that have relatively low numbers of felonies. =======We first created a visual showing clusters and pockets of the 3 types of felonies in absolute numbers.
From this visual, we can easily spot areas within each borough that have relatively low numbers of felonies. >>>>>>> ad378d97a5a0c24088e7bad4b45b6cebaecf063eWe decided to take the visual one step further by incorporating zip codes and creating heat maps to show prevalence of these 3 felony groups across NYC.
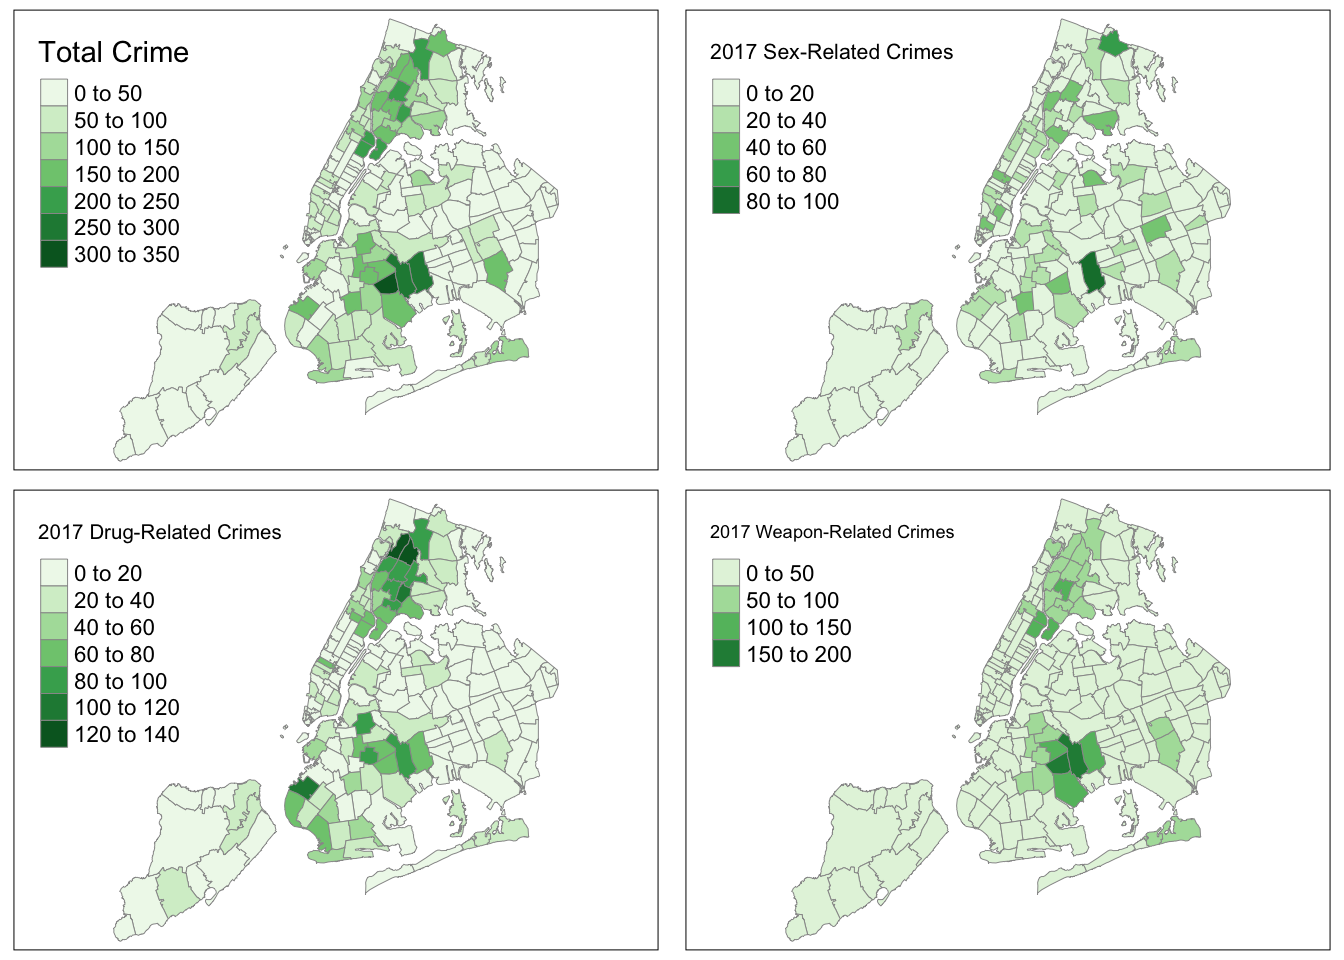
The heat maps provide an easy way of visually describing the absolute numbers of overall felonies, as well as felonies by each of the 3 types. Overall, we see these crimes occur most in central brooklyn and bronx. This picture is very similar when we look at the picture for only sex-related crimes and weapon-related crimes. In looking at the map for drug-related crimes, we see that the crimes are distributed among most 3 areas - central and south brooklyn, and bronx.